Beyond CSAT: Choosing (and using) the right metrics for your customer service team

About two years ago, a member of Olark’s customer service team decided to run an experiment. Sarah Betts spent three months responding to chats under three different names and avatars — first as “Samuel”, featuring a male profile photo, then as “Sam”, featuring a bit of androgynous clipart, and finally as herself, Sarah, with the same photo she’d used as a live chat agent for the past several years.

Some of the results were predictable. Sarah had to block more trolls; Samuel’s technical recommendations carried more weight, and as a result, he escalated fewer issues to engineering. One outcome, however, surprised everyone — compared to Samuel, Sarah and Sam had significantly higher customer satisfaction (CSAT) scores.
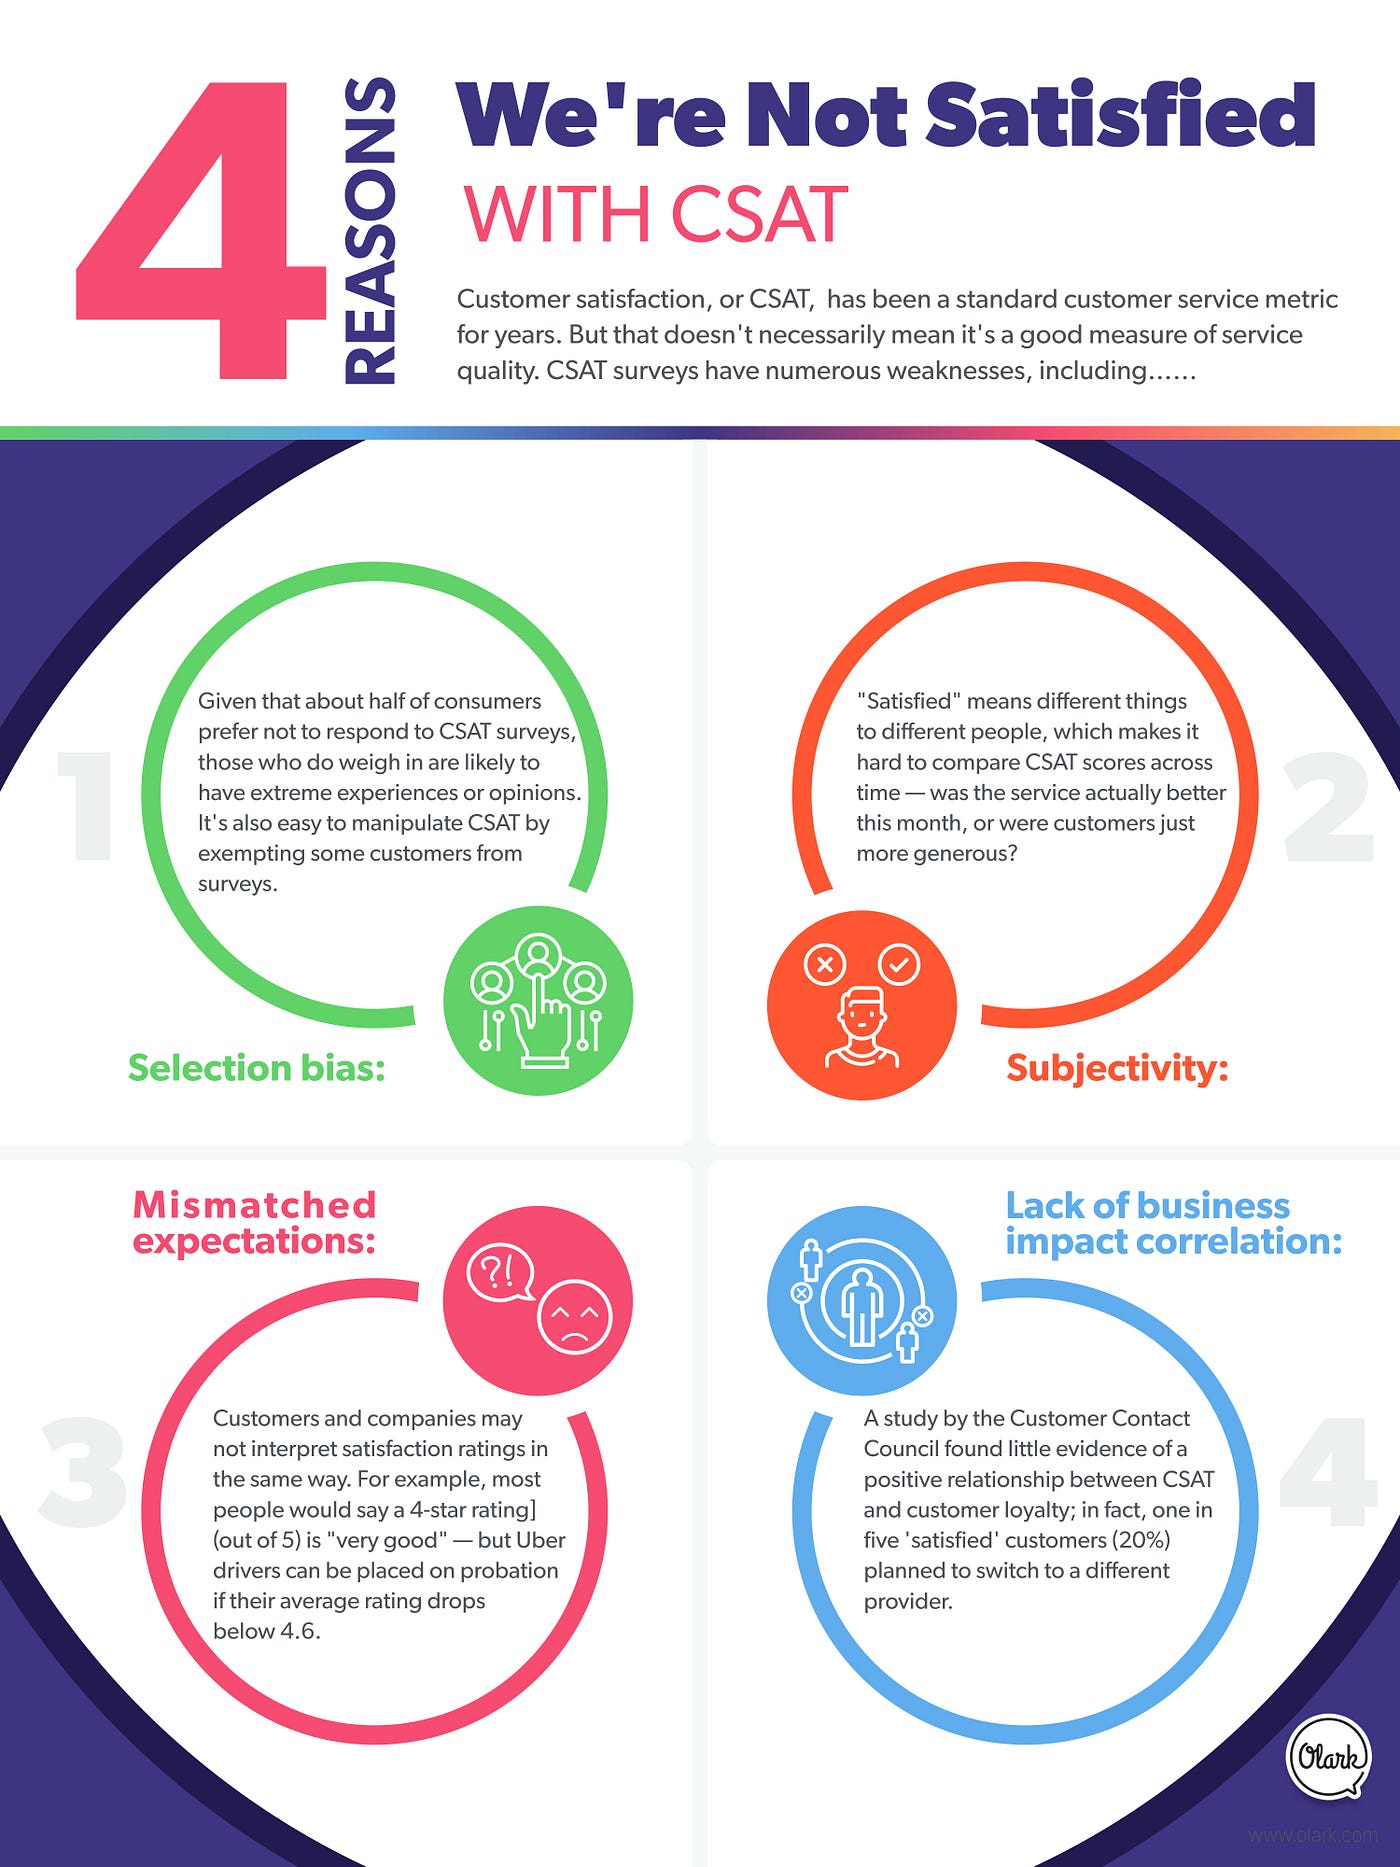
CSAT has been a standard customer service metric for years. But as Sarah’s experiment demonstrated, that doesn’t necessarily mean it’s a good measure of service quality. Samuel, Sam, and Sarah all responded to chats in the same tone and leaned on the same resources to solve problems. But customers were less “satisfied” with Samuel’s service. Did they expect more from a male agent? Were they predisposed to see a female as helpful? We can’t know for sure, but it’s clear that satisfaction ratings are influenced at least in part by factors outside the agent’s control.
Satisfaction as a service metric has other issues, too (see the graphic below). CSAT surveys (and other subjective survey-based metrics, such as net promoter score) are susceptible to selection bias, and there’s evidence to suggest that satisfaction ratings are interpreted differently by consumers as opposed to companies. Most importantly, it’s not clear that satisfaction is actually correlated with churn, customer loyalty, or lifetime value.
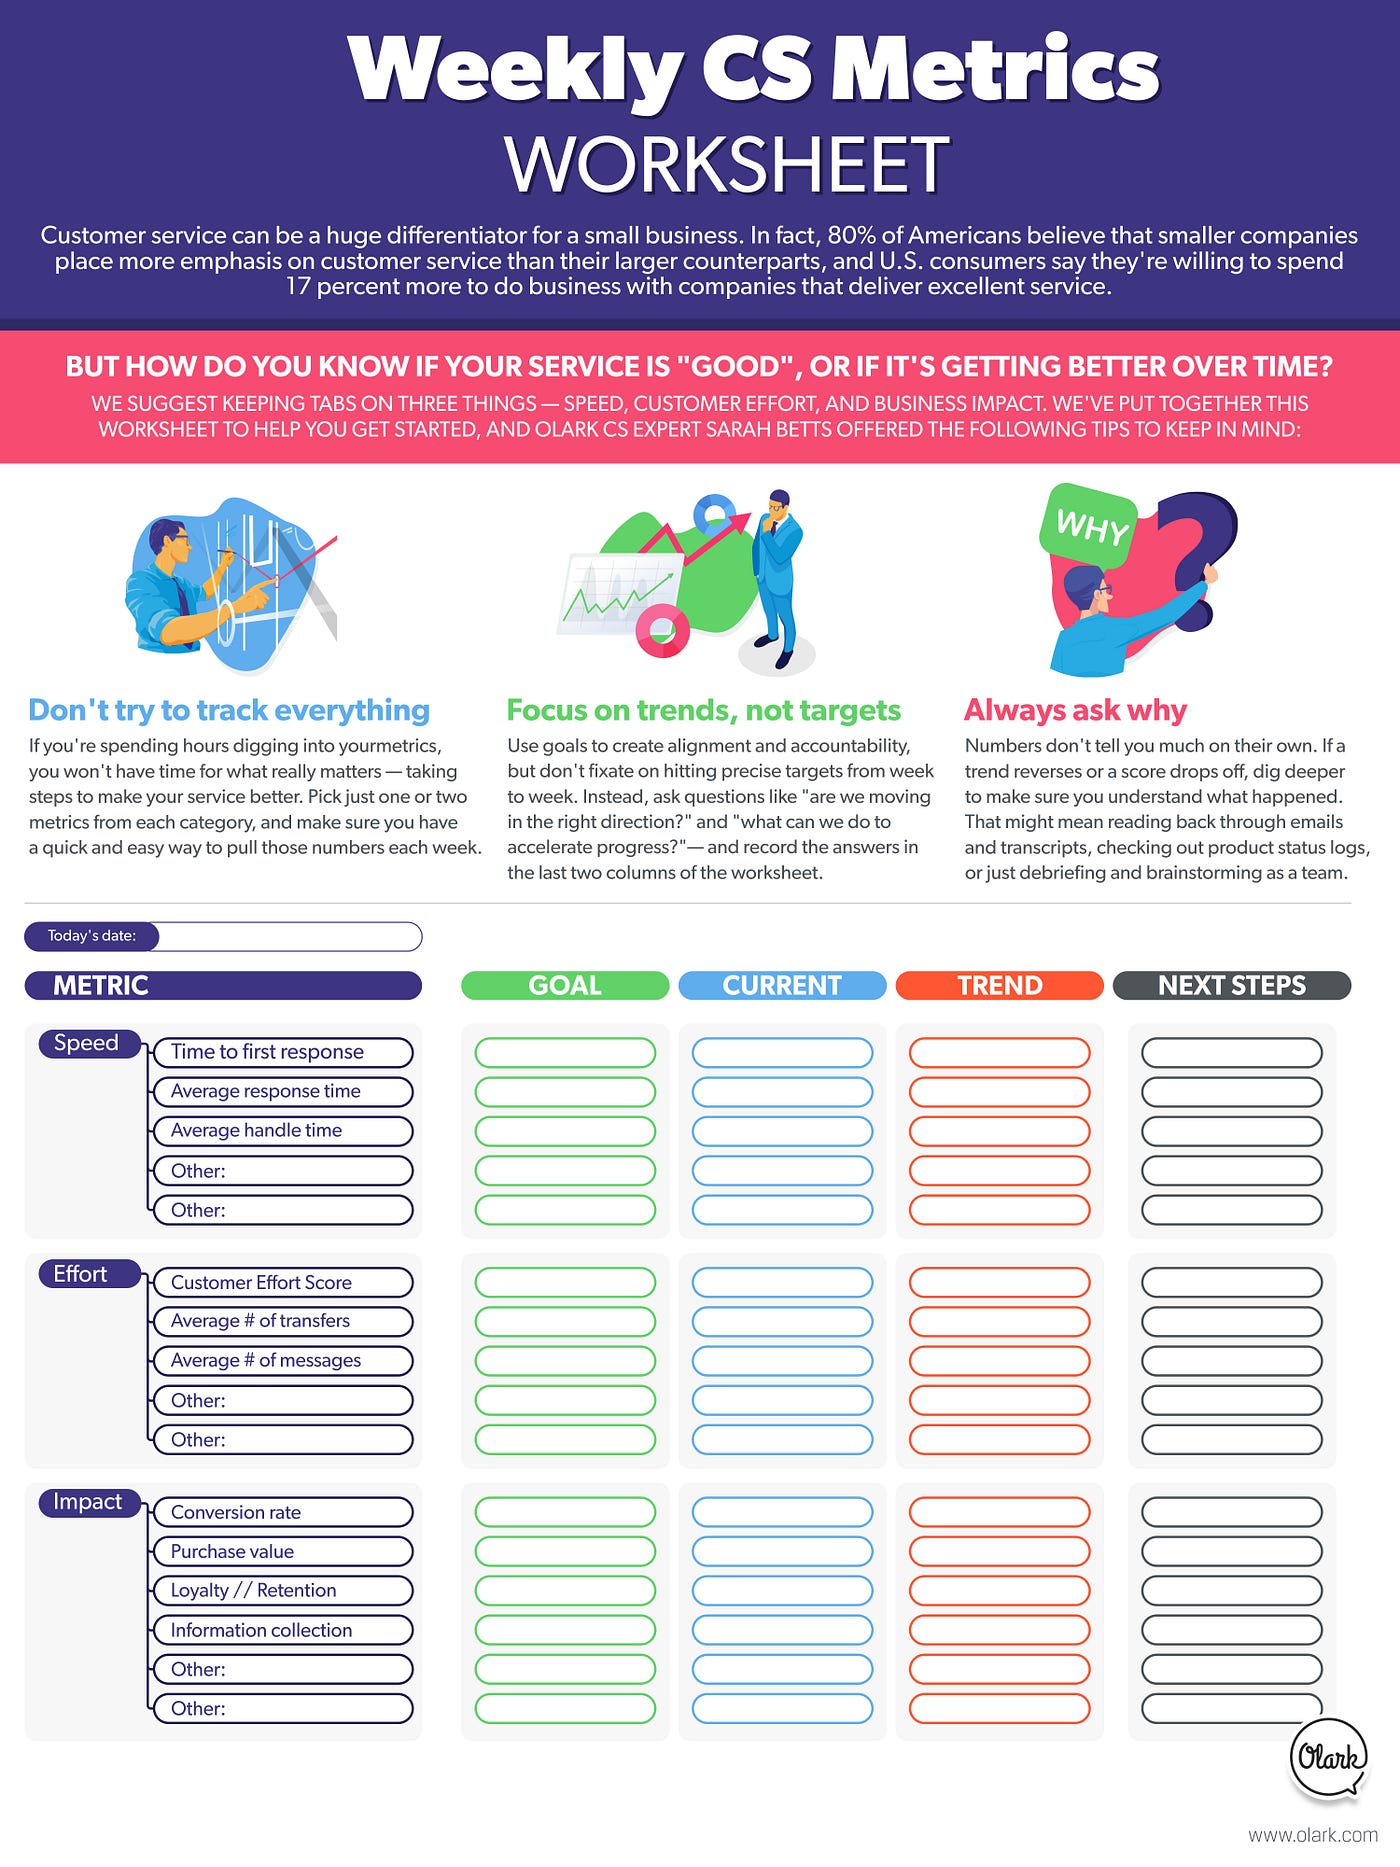
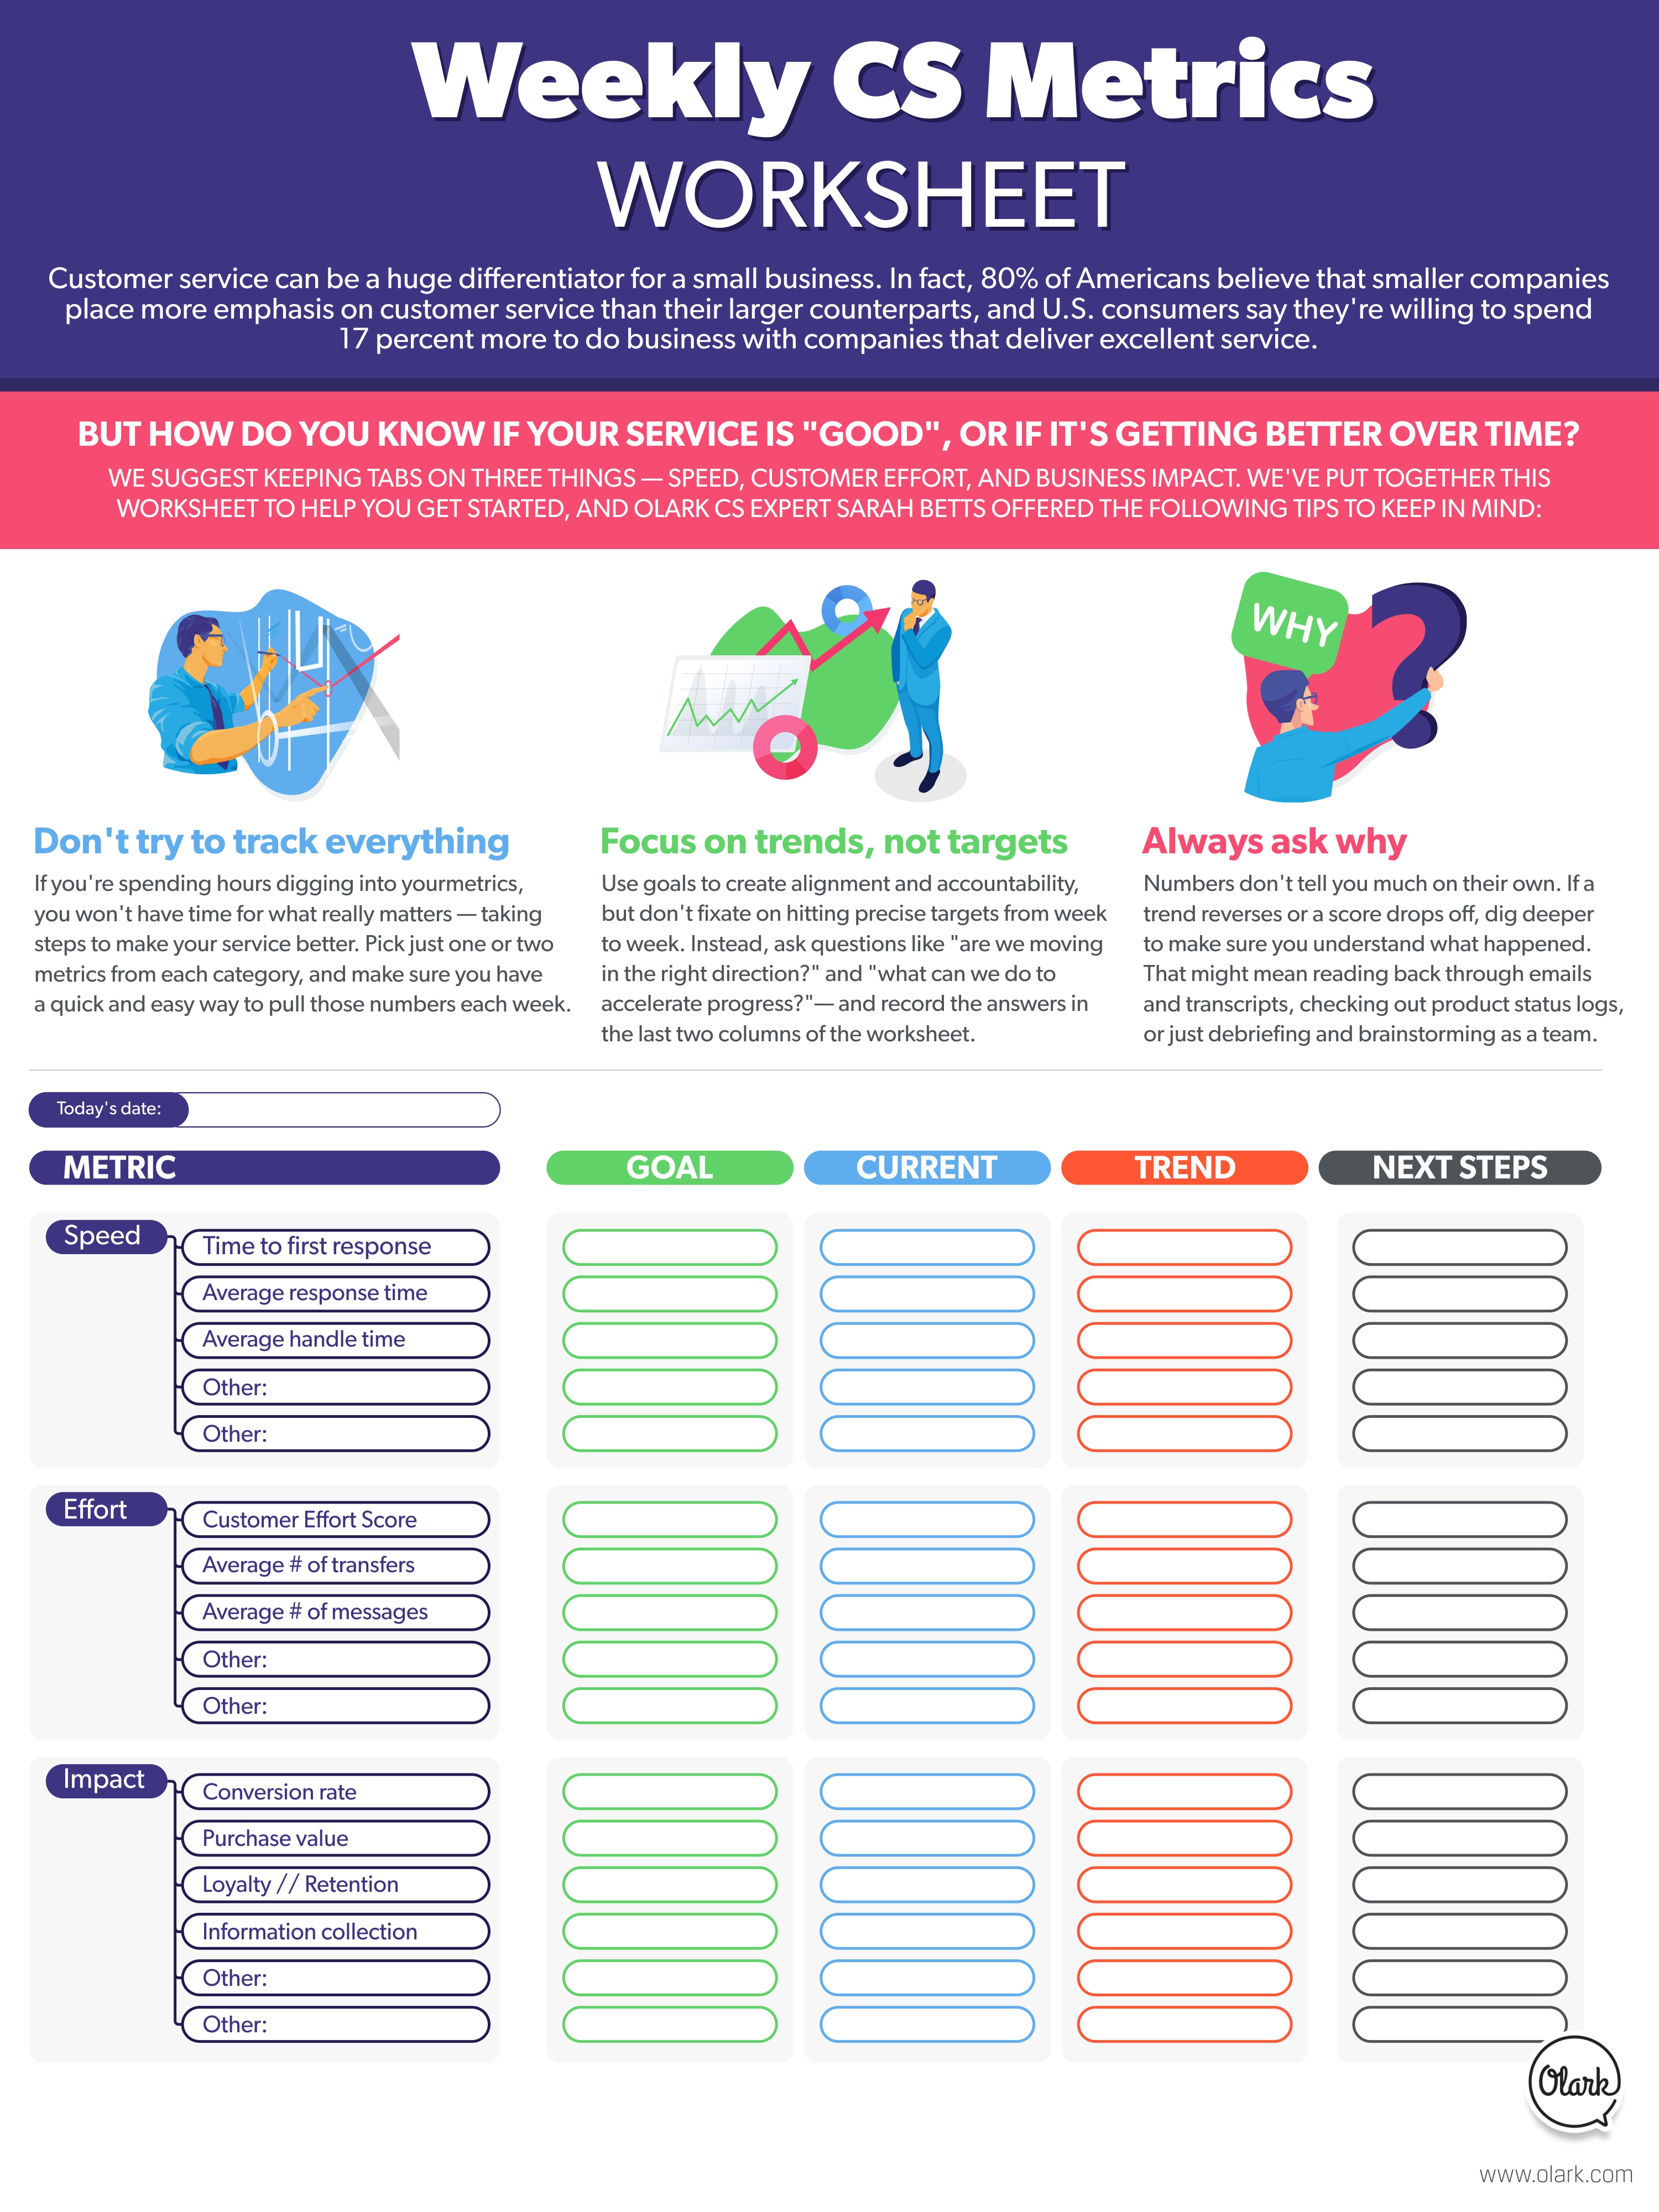
What, then, constitutes “good” customer support? Reliable performance indicators are important, especially for small businesses — U.S. consumers say they’re willing to spend 17 percent more to do business with companies that deliver excellent service, and 80% of Americans believe that smaller companies place more emphasis on the customer experience than their larger counterparts. Good service is a competitive differentiator, and small businesses need to know how they’re doing in order to continuously improve.
If satisfaction is suspect, we’re left with a few other options: break satisfaction into more specific components, or measure something else entirely, such as response times, customer effort, or business impact. Let’s look at the pros and cons of each in turn.
Dissecting customer satisfaction
Satisfaction is problematic in large part because it’s so subjective. If we can get more specific about what it means for customer service to be “satisfactory”, we might get more useful insight from satisfaction surveys.
At Olark, we’ve done this by breaking our post-chat ratings survey into five questions. The first question asks about overall satisfaction. The next three questions ask for specific feedback on the agent’s knowledge, responsiveness, and friendliness, and the final question is an open text field for additional comments.
Knowledge, responsiveness, and friendliness are still subjective. But by asking these three additional questions, we’ve at least given the customer some guidance for evaluating satisfaction — and if a chat receives a low overall rating, we’ve made it easy to dig deeper and understand why it fell short. It’s also possible to customize the language in the post-chat survey through the Olark API (scroll down to see API calls for “chat ratings strings”), which allows anyone using our product to replace “knowledge, responsiveness, and friendliness” with the measures that best reflect their team’s service priorities.
Despite its shortcomings, CSAT is a common support experience metric, and will probably be around for a while. If your team isn’t ready to abandon it entirely, that’s completely understandable — but going one small step further, to examine different factors that might contribute to satisfaction, can still make your metrics more actionable.
Resolution and response times
There’s no question that speed is important in customer service. Today’s consumers are time-strapped and accustomed to instant gratification. Most won’t have anticipated spending even a few seconds — much less minutes or hours — to get a question answered or problem solved, and if the response is too slow, they’ll simply take their business elsewhere.
It makes sense, then, that many customer service teams use speed as at least a partial proxy for quality. Exact methods vary from team to team, but some of the most common speed-based metrics include:
- First response time: How long does it take, on average, for a human agent to acknowledge a customer’s inquiry?
- Average response time: Across all messages, including initial inquiries and followups, what is the average time it takes for a human agent to respond to a customer?
- Resolution time: How much total time does it take an agent to resolve an average issue? For example, the resolution time might be measured as time elapsed between the first response and a ticket being marked “resolved”. Related metrics include resolution rate (percent of issues that are resolved within a given time period) and first contact resolution rate (percent of issues resolved on the first interaction).
At Olark, we track all three of these numbers, and report them to the team on a weekly basis. But — and this is a big “but” — we try not to fixate on small changes in speed. Ultimately, we’re looking for long-term trends. If we’re getting consistently slower over time, that’s worrisome (and if we’re getting faster, that’s awesome!), but we don’t read too much into minor blips.
We also try to use speed metrics as a jumping-off point to understand the factors that impact our performance. If response times went up, for example, can we link that to a day when we were shorthanded on chat, or to a downtime that caused a surge in tickets? Is a slow average resolution time pointing to a general trend, or do we have a few open requests — perhaps related to a longstanding bug — that are dragging that number up, despite good performance overall?
Finally, we know that speed isn’t the entire story. Speed metrics are easy to manipulate; a fast response, for example, is only good insofar as it includes helpful information or questions that move the conversation along. Focusing only on speed creates incentive to fire off meaningless one-line responses, or to close tickets without properly addressing underlying problems — and that’s not good for anyone.
Customer effort metrics
Speed-based metrics tell us a lot about how quickly a support team is working, but next to nothing about how positively or negatively that work impacts customers. But just asking customers whether they’re satisfied doesn’t seem to give us good insight, either. Is there another customer-centric metric we could use instead?
There might be. In the past few years, several companies have moved to adopt a new metric: the Customer Effort Score, or CES. CES is similar to CSAT, but rather than rating their satisfaction with a service interaction, customers are asked to respond to a different question:
On a scale from 1 to 5, with 1 being “very little” and 5 being “quite a lot”, how much effort did you personally have to put forth to handle your request?
Of course, CES surveys have many of the same issues as their CSAT cousins. They’re still susceptible to bias and manipulation, and effort is still subjective and relative (although arguable slightly less so than satisfaction). However, in the same study referenced above, the Customer Contact Council found a much higher correlation between CES and loyalty — 94% of customers who reported low effort said that they would buy from the company again, while 81% of those who reported high effort said they would steer their friends and colleagues (and, presumably, their own spending power) elsewhere.
Unlike satisfaction, effort can also be measured directly to some extent. Most customers base their assessment of effort on similar factors — it takes extra effort to follow up repeatedly, for example, or when to rehash a story for multiple agents. This insight suggests a few possible direct measures of effort, including:
- Average number of transfers and/or escalations per inquiry — if customers are routinely transferred to a different agent after their first interaction, the company could reduce effort by improving ticket assignment and routing procedures, or by giving frontline agents the tools to resolve more issues directly. When transfers are unavoidable, ensuring that context is transferred along with the customer will also help to keep effort low.
- Average number and/or length of customer messages per inquiry — if customers are responding to a long string of questions, clarifying information repeatedly, or following up frequently to check on progress, the company could reduce effort by consistently tracking, storing, and surfacing essential customer information, and by improving policies and processes around regular proactive followup.
Of course, there’s no avoiding the fact that some issues are just complicated, and will take a certain amount of effort from all parties to resolve. But there’s still a lot your team can do to make the customer feel like the process is easy — setting expectations, communicating frequently, avoiding repetition, etc. When you do have an interaction that’s objectively high-effort based on the metrics above, consider sending the customer a CES survey; if they still report a relatively low-effort experience, you have ample reason to celebrate.
Business impact metrics
We know that customer effort is to some extent correlated with loyalty. Are there other, more direct ways that we could measure the impact of customer service on bottom-line revenue and profit?
Connecting service to revenue is trickier than measuring speed or effort, but that doesn’t mean it’s not possible. In particular, if you’re selling online, you’re likely already using analytics tools (e.g., live chat paired with Google Analytics) that can help you approximate your customer service ROI. Here are a few suggestions to get you started:
- Compare conversion rates: Measure your average landing or product page conversion rate (across all website visitors), and then segment out customers who’ve interacted with your service team. Do customers who’ve had a service interaction tend to convert at a higher rate? Even if not, is the conversion rate for the customer service group going up over time?
- Compare purchase value: Similar to the above — do customers who interact with your service team tend to place bigger orders, or is their average order value increasing as you optimize your service approach?
- Track loyalty: Of customers who interact with your service team, what percentage make a repeat purchase within a certain time frame? Is that percentage higher or lower than your overall repeat purchase rate, and how is it changing over time?
- Measure information acquisition: Customer service teams also impact revenue indirectly by helping the company learn more about their customers — from demographic data, to product requests and feedback, to perspectives on competitors. You can quantify this benefit by measuring the rate at which agents acquire and share information — e.g., what percentage of interactions result in data or notes added to a CRM or customer database?
There’s no question that today’s shoppers expect more from customer service. And that’s exciting — it means that small businesses have an opportunity to distinguish themselves and win loyalty by going above and beyond. But it also means that small businesses need to have a firm grasp on what “good” service really means, and a meaningful framework for measuring progress.
A combination of satisfaction, speed, effort, and business impact metrics can help you understand your performance and stand out from the crowd. If your customer service metrics could use a refresh, we have a worksheet — and some tips from our own resident customer service scientist, Sarah Betts — to help you get started.